Beth Robertson

Data Analyst | Problem Solver
Let's go get some insights!
View My LinkedIn Profile
Code for the Hospital Data Analysis Project using MySQL
Project Description
This page shows the code I used for the different steps of this project.
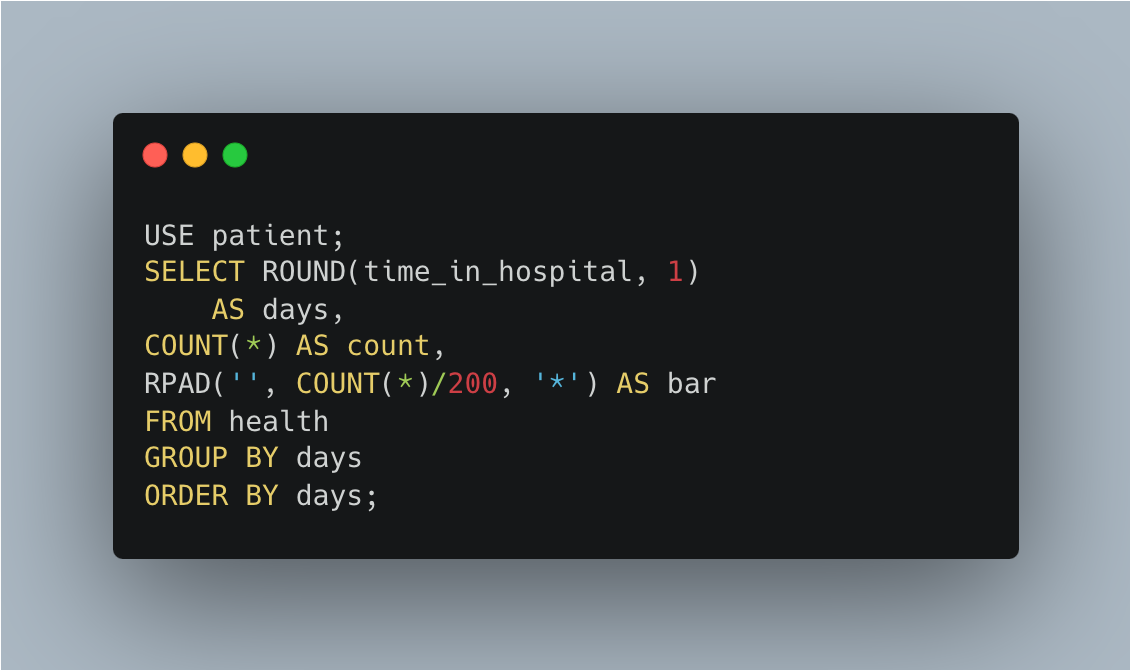
Number of Days
I used a bar chart to show the number of patients who stayed a certain number of days to understand if most patients in the study stayed fewer than 7 days in the hospital.

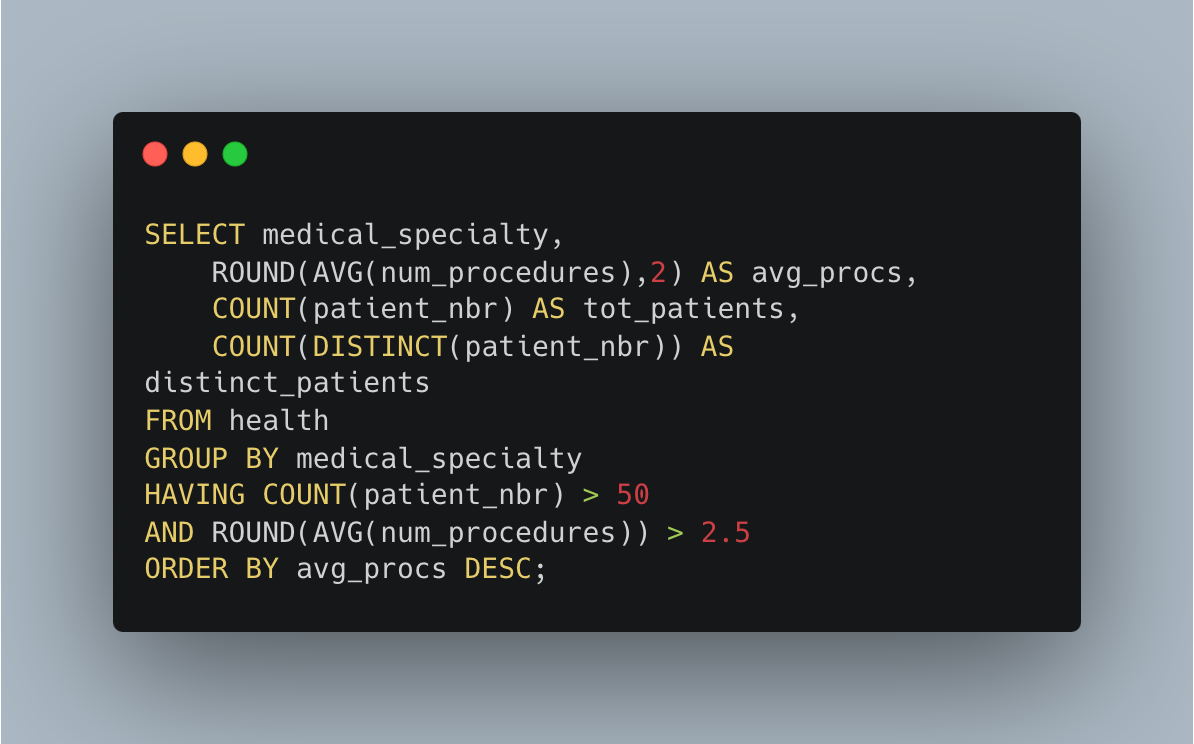
Specialities
To answer the question of which specialities are performing the most procedures, on average, I created a table. I limited the data to show an average of 2.5 procedures per visit per patient, with at least 50 patients.

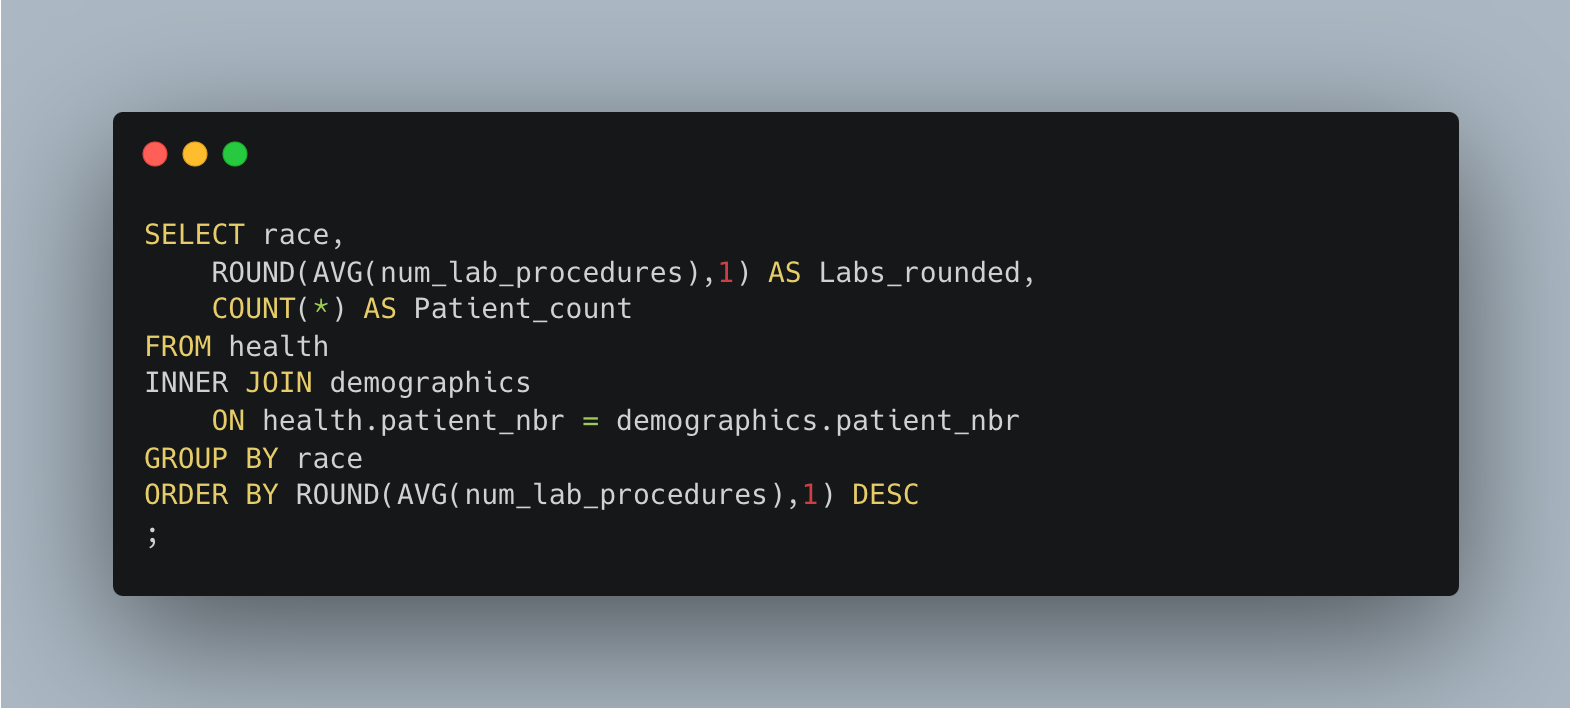
Lab procedures by race
I found out the the number of lab procedures doesn’t not vary significantly by race. I grouped by race and ordered by the count of the average number of lab procedures.
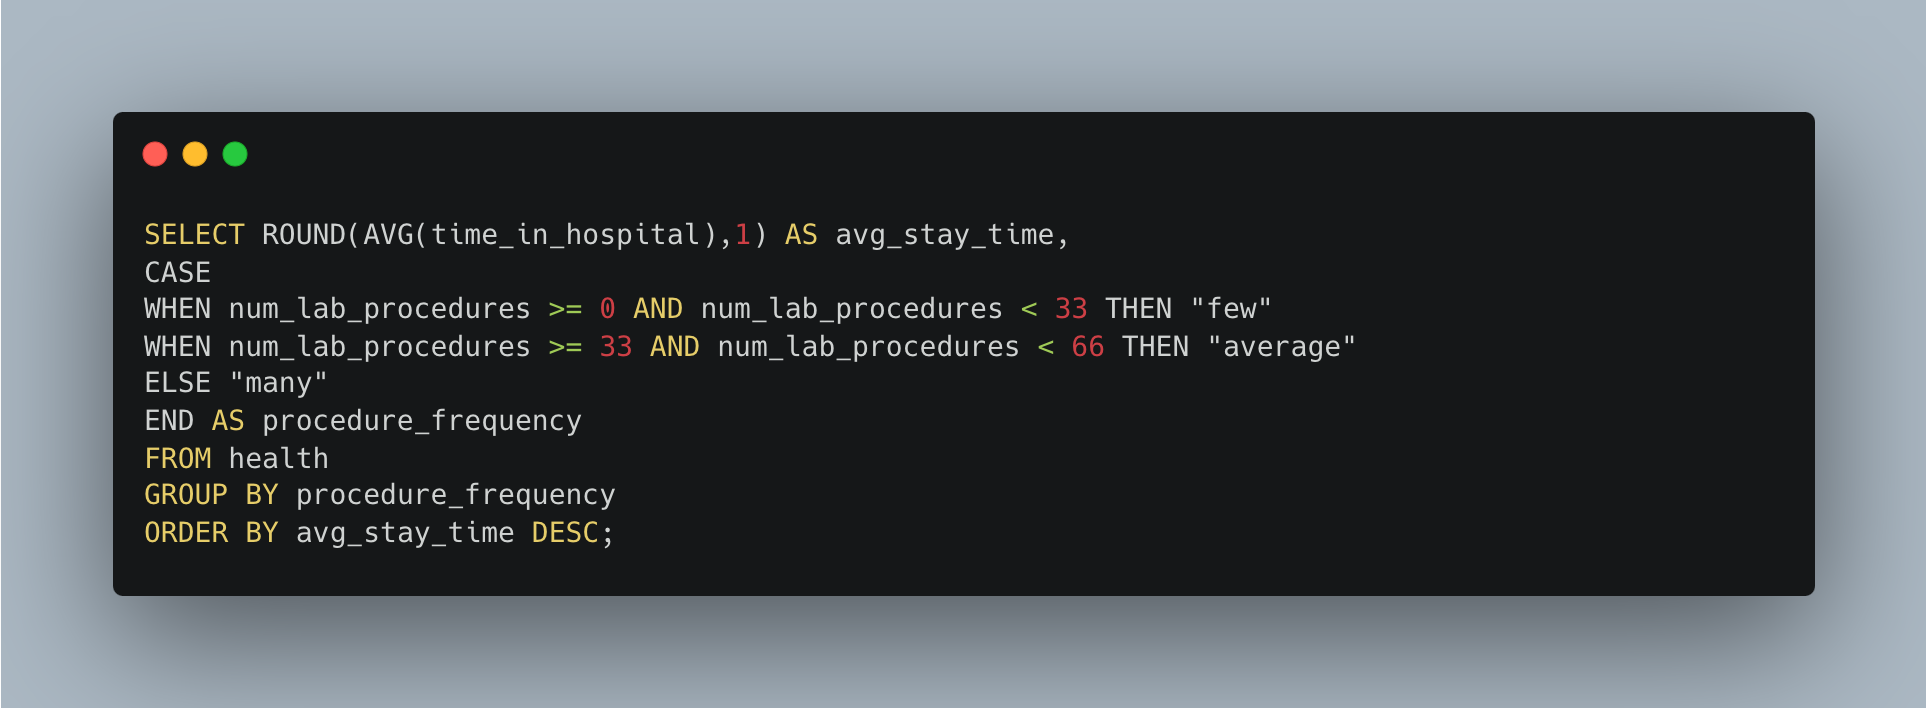
Average length of stay related to number of lab procedures
A ‘CASE WHEN’ statement allowed me to group the number of lab procedures into Many (>66), Average (33 - 66), and Few (<33) groups and then to look at days of stay for each of those groups.
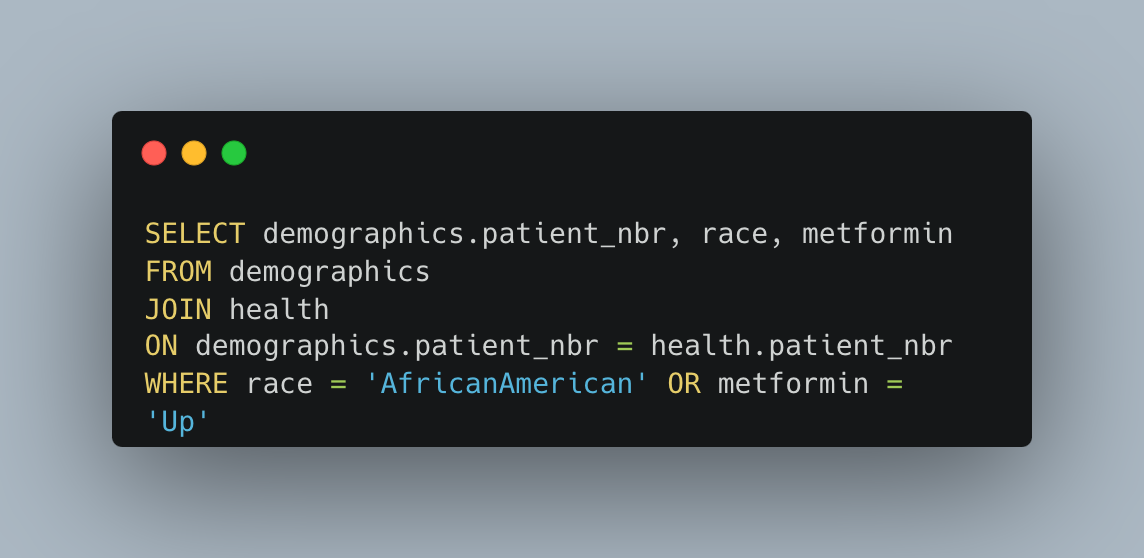
Up for Metformin
I was able to create a list of patient numbers that have a race of African American or a result of “Up” for Metformin by joining the Health and Demographics tables.
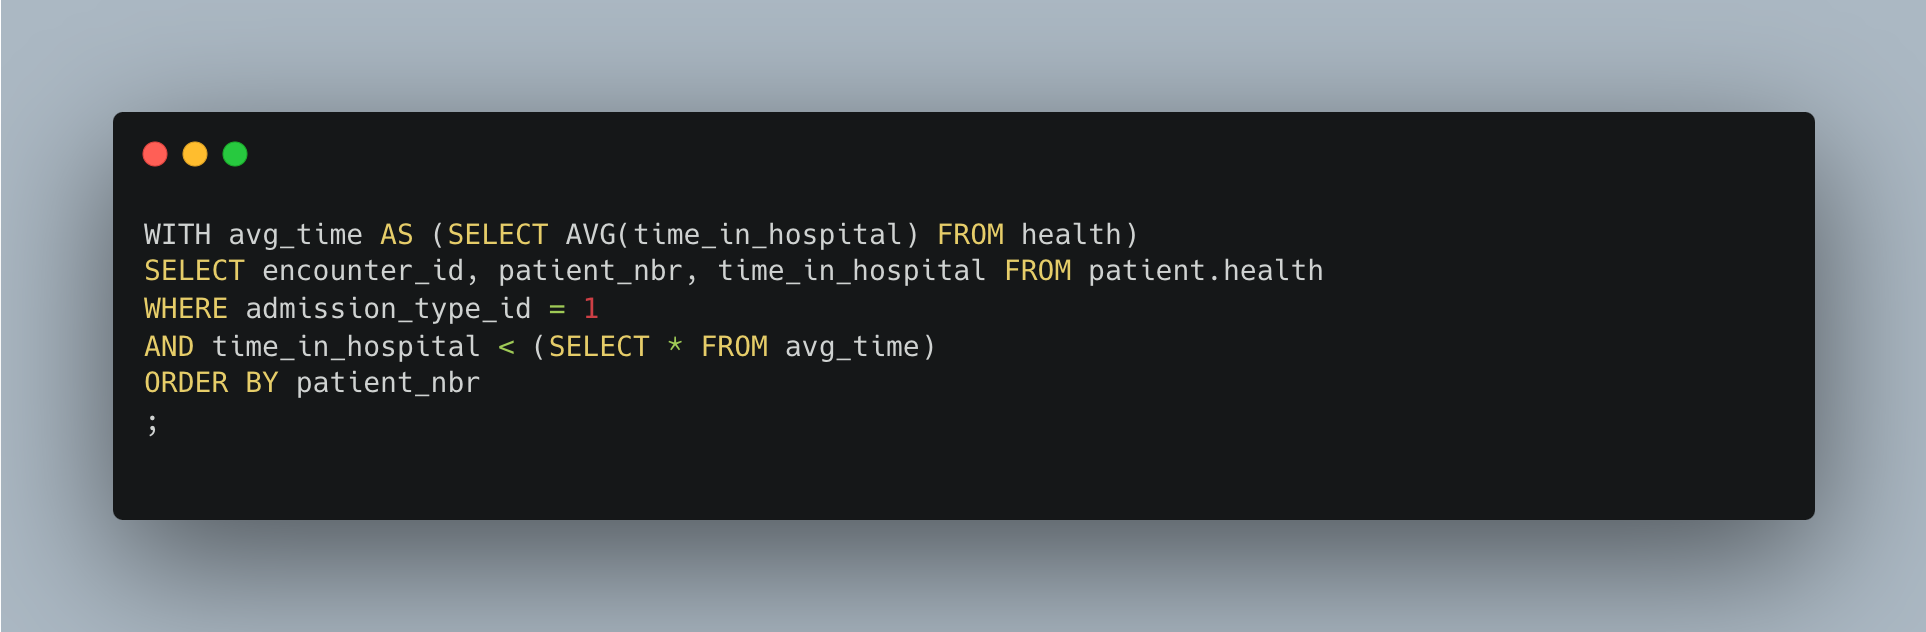
Hospital stays less than average stay length
Using a CTE, I was able to find patients with a shorter than average length of stay who were admitted with an emergency admission.

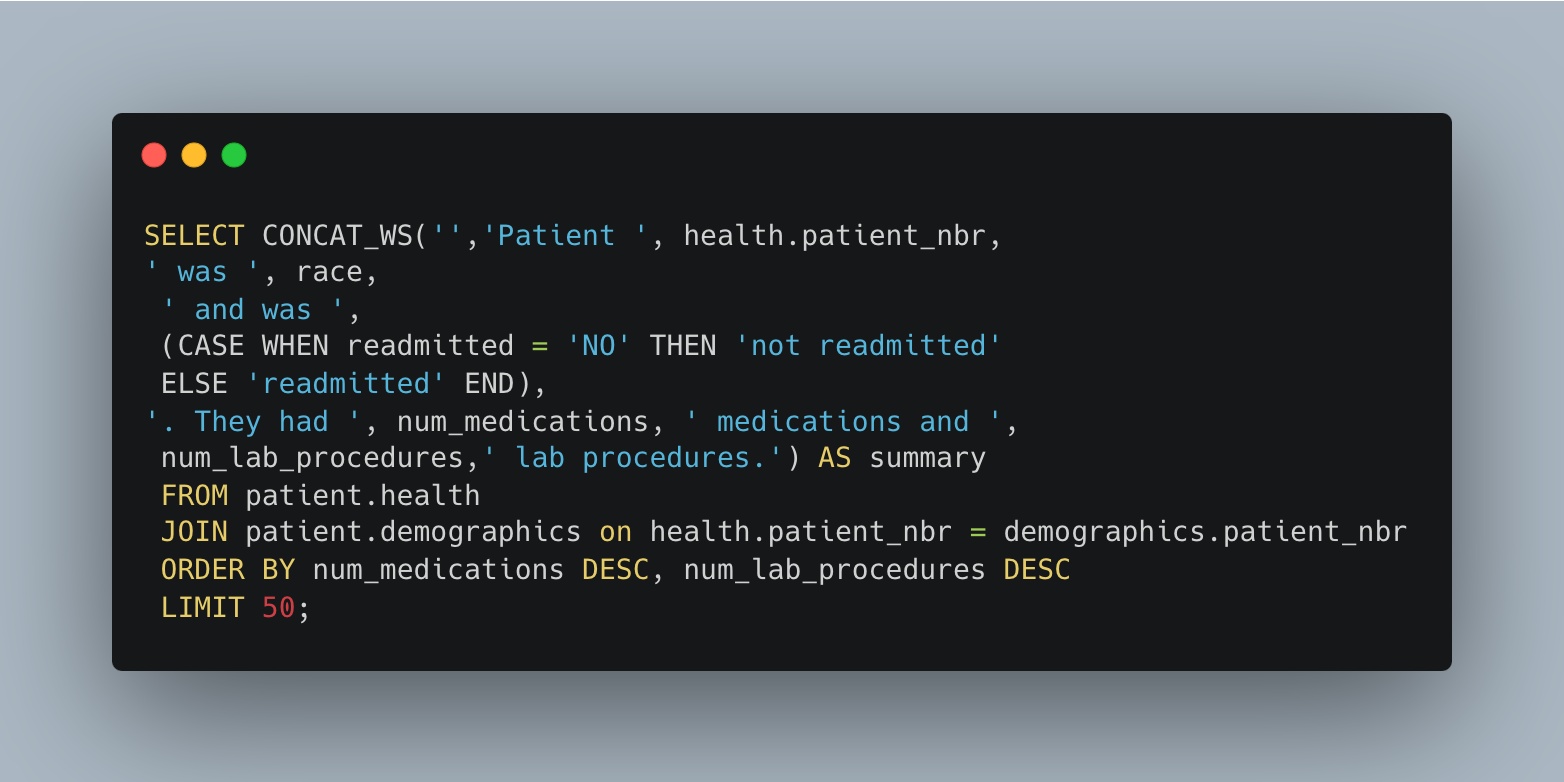
Readmission Summary
‘CONCAT_WS’ and a ‘CASE WHEN’ subquery allowed me to create a list of readmitted patients sorted by the number of medications and lab procedures they received while they were in the hospital.