Beth Robertson

Data Analyst | Problem Solver
Let's go get some insights!
View My LinkedIn Profile
“New” House Electricity Project
Project Description Our son lives on a small property on the west side of Elgin, IL. At the beginning of August, he received the electricity bill for July. It was almost $400! We were fairly shocked! We live in Houston, TX and it was a blazing-hot summer here. N’s house is 2100 sq. ft. and ours is 2800 sq. ft. Our July bill was nowhere near $400. So I decided to analyze the data to see why his bill was so much higher than ours.
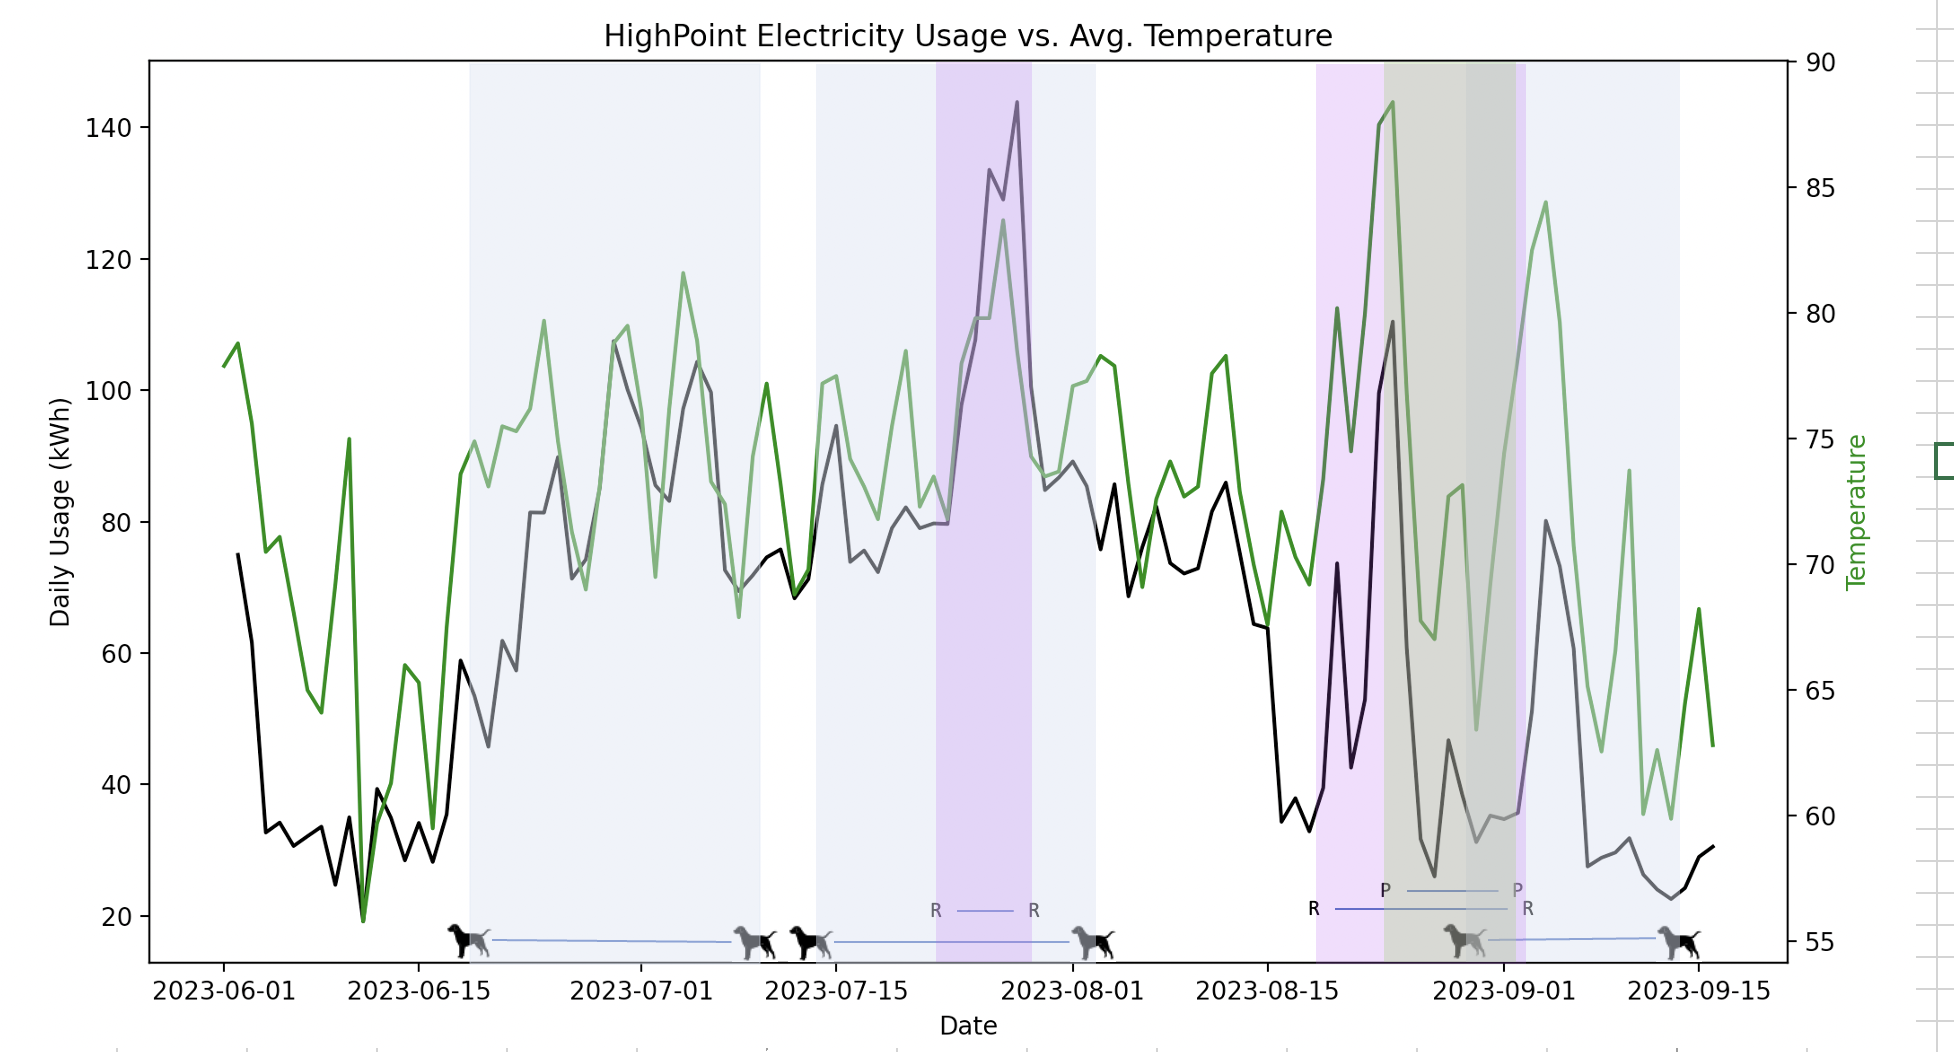
The Big Reveal The final chart shows that the electricity cost is most affected by the temperature, not by any of the many other factors we thought might be in play. So now we know. More a/c when it’s hotter. (Surprise!)
Background
This is the first summer that we have owned this property so we have no historic data to compare with. What we did have were a lot of questions about possible factors at play here, other than the temperature. Some of these questions were:
- Does electricity cost more in western Elgin, IL than in Houston, TX?
- What effect did using the window a/c units in the house have on the total usage? We used the window units when human guests stayed upstairs.
- Did having boarding dogs affect the amount of electricity used? The doggie guest house also uses a window a/c unit.
- What effect does the age of the system have on our usage and costs?
One bonus: we installed a weather station on the property when we were there at the end of August. So from August 25 forward, we have exact temperature data for our location.
Collecting the Data The first thing I did was compare electricity costs between Houston and Elgin. It turns out that we are paying almost the exact same amount per kWh in both locations. So that wasn’t a factor.
Next, I gathered our electricity usage info from the ComEd site and entered it into an Excel spreadsheet. Then I pulled our personal temperature data, captured by our weather station and synced on the Ambient Weather Network. This left a gap in the temperature information of a few months when N lived there and we didn’t have the weather station. So I pulled temperature data from O’Hare airport (which is not too far away) through the NOAA Center for Environmental Information. It turned out that getting all of the temperature information into Excel was going to be a tedious exercise since the timeframes from O’Hare and ComEd weren’t the same. So I changed from Excel to Python to build the final dataset that contained all three inputs.
Cleaning and Analyzing the Data I pulled the date and cost from the ComEd data, and the min, max, and mean of the O’Hare and Ambient temperature datasets. Once I fixed the names of the columns, I combined all three datasets by date using an outer merge in Python. Then, using Seaborn, I plotted a few different combinations until I settled on the average temperature vs. the average usage by day. This told me that the electricity usage was definitely tied to the temperature. But what about the other questions - did human or dog guests impact usage significantly? I mapped dog symbols onto the graph to show where N had client dog boarding and letter symbols for when he had human guests (R is his sister, P is for parents).
Conclusion The final conclusion was that the biggest factor for electricity usage was only the temperature. Human or dog guests didn’t raise the usage in any noticeable way. So at least we know!
P.S. What about the question of the age of the system? We don’t know yet what impact that has on the costs. We know the current system is about 20 years old and only has one zone, so we suspect that a new system, with multiple zones, would be more efficient and might lower our electricity costs. But that’s a different project!!